Platform foundation
QENEX Suite
A shared layer for drivers, protocols, variables, and application runtime that concrete solutions can build on.


QENEX Suite is a modular software platform for control, logging, and visualization of real-time data to and from electronic devices — ECUs, controllers, and computers.
QENEX Suite platform
QENEX Suite solves device connectivity, repeatable data work, and a desktop environment for technical teams.
A shared layer for drivers, protocols, variables, and application runtime that concrete solutions can build on.
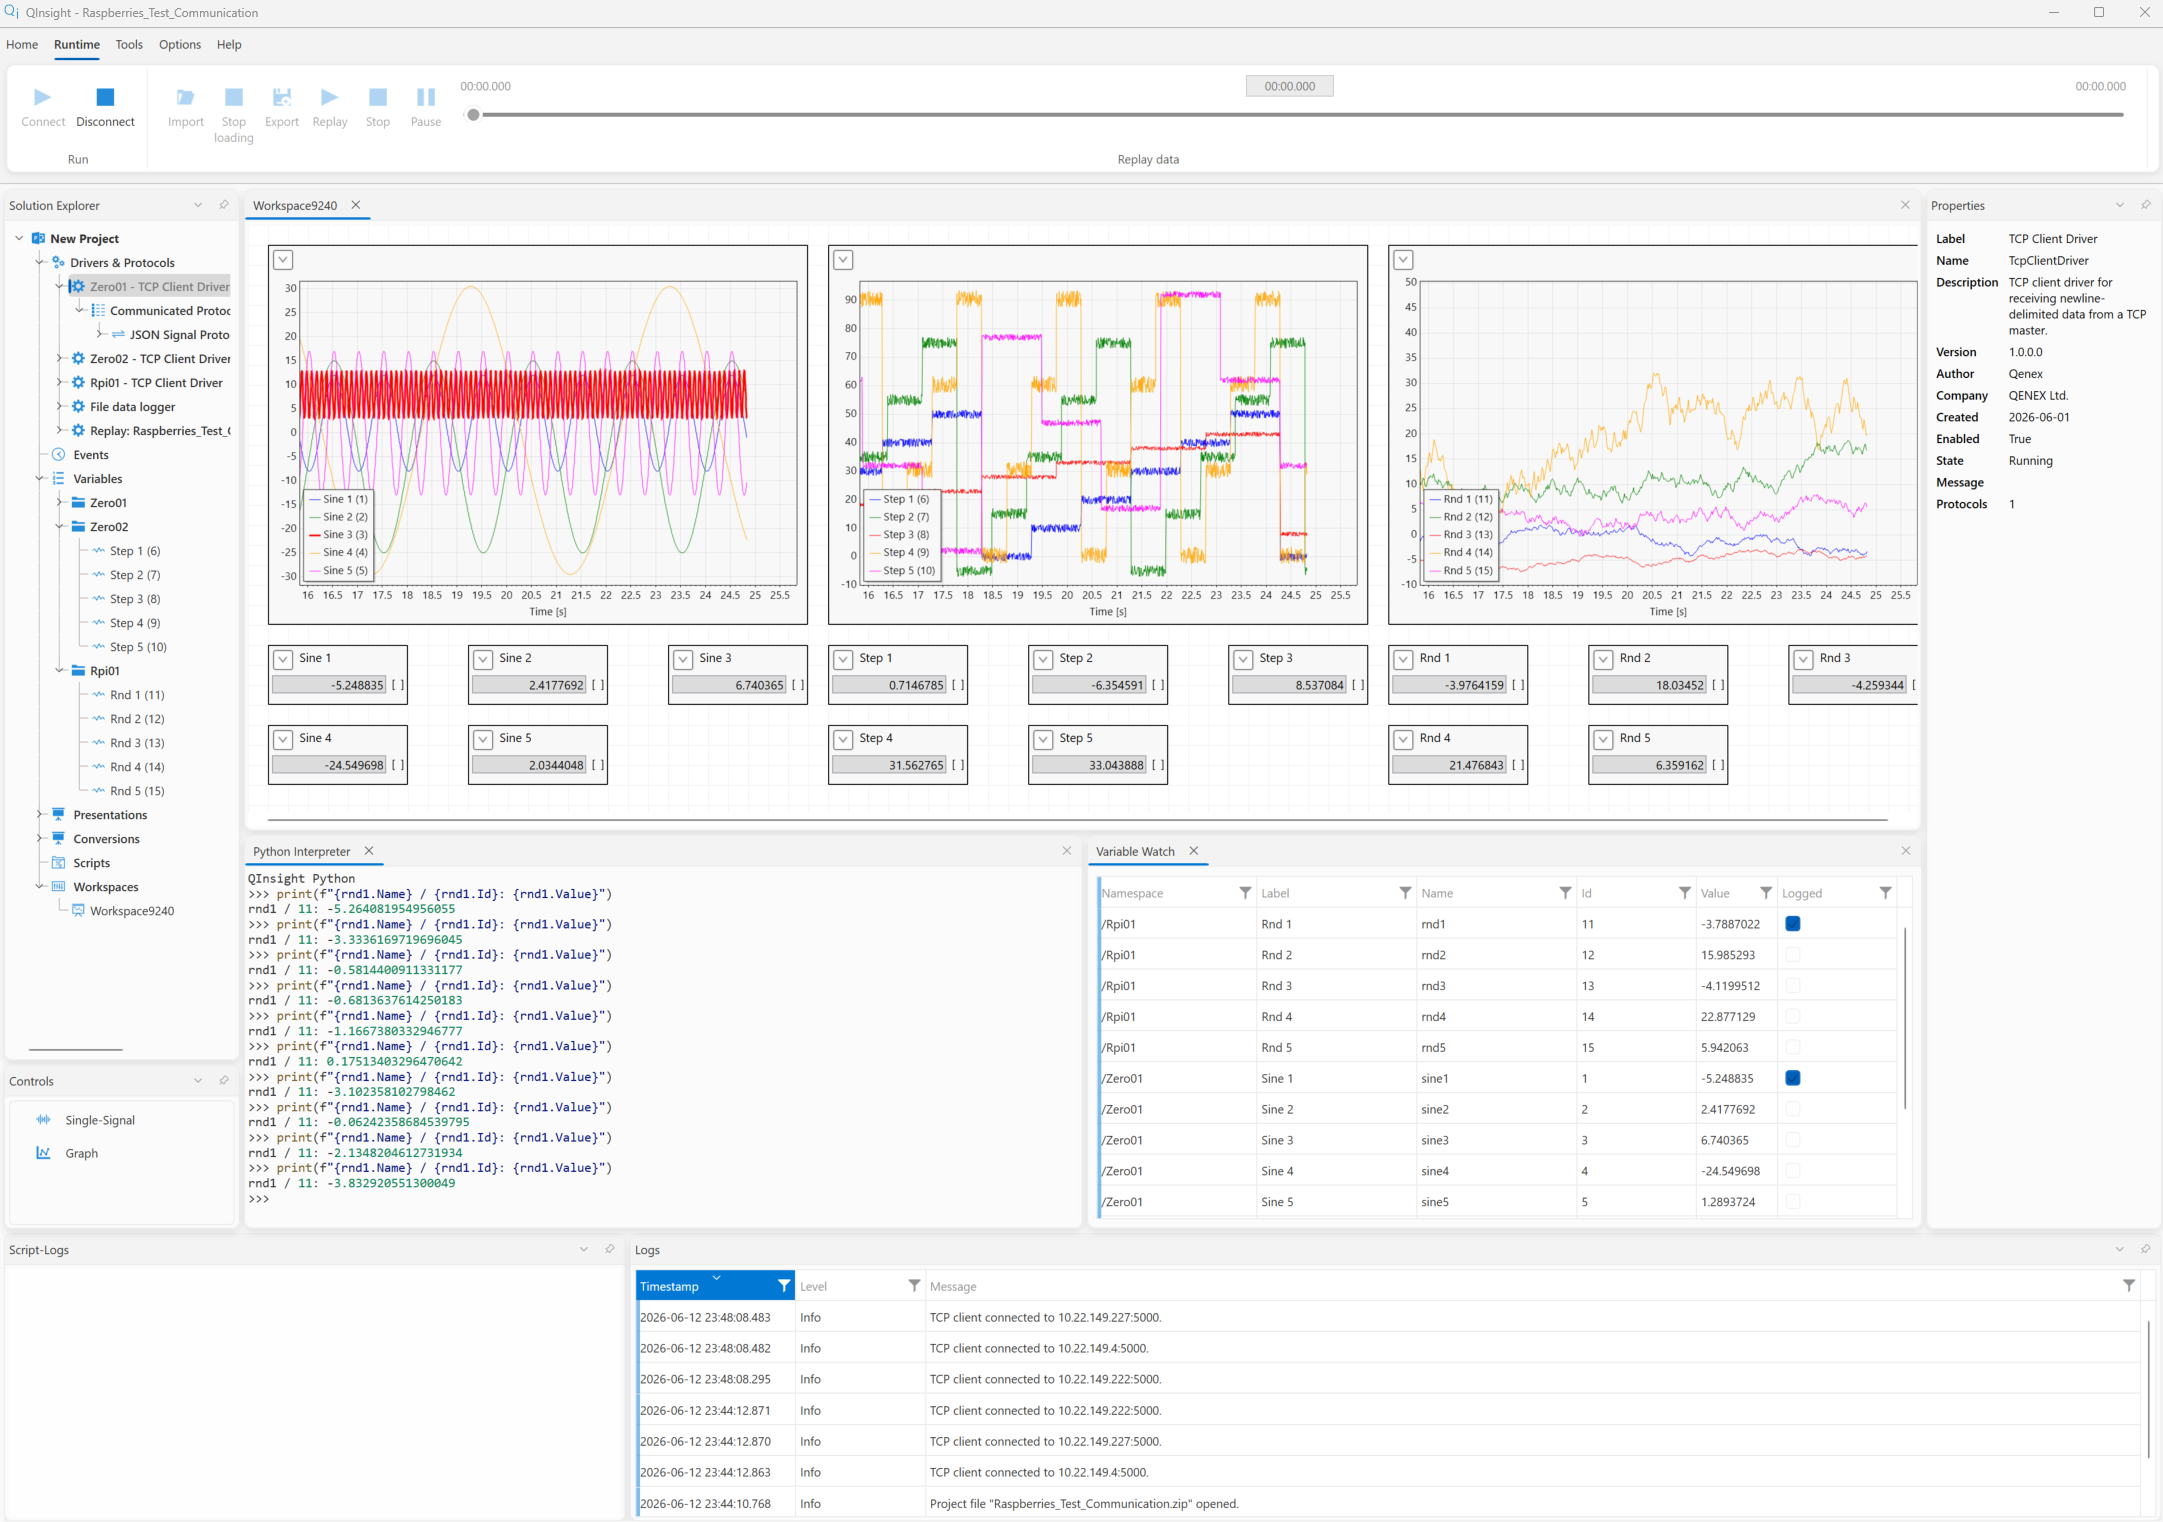
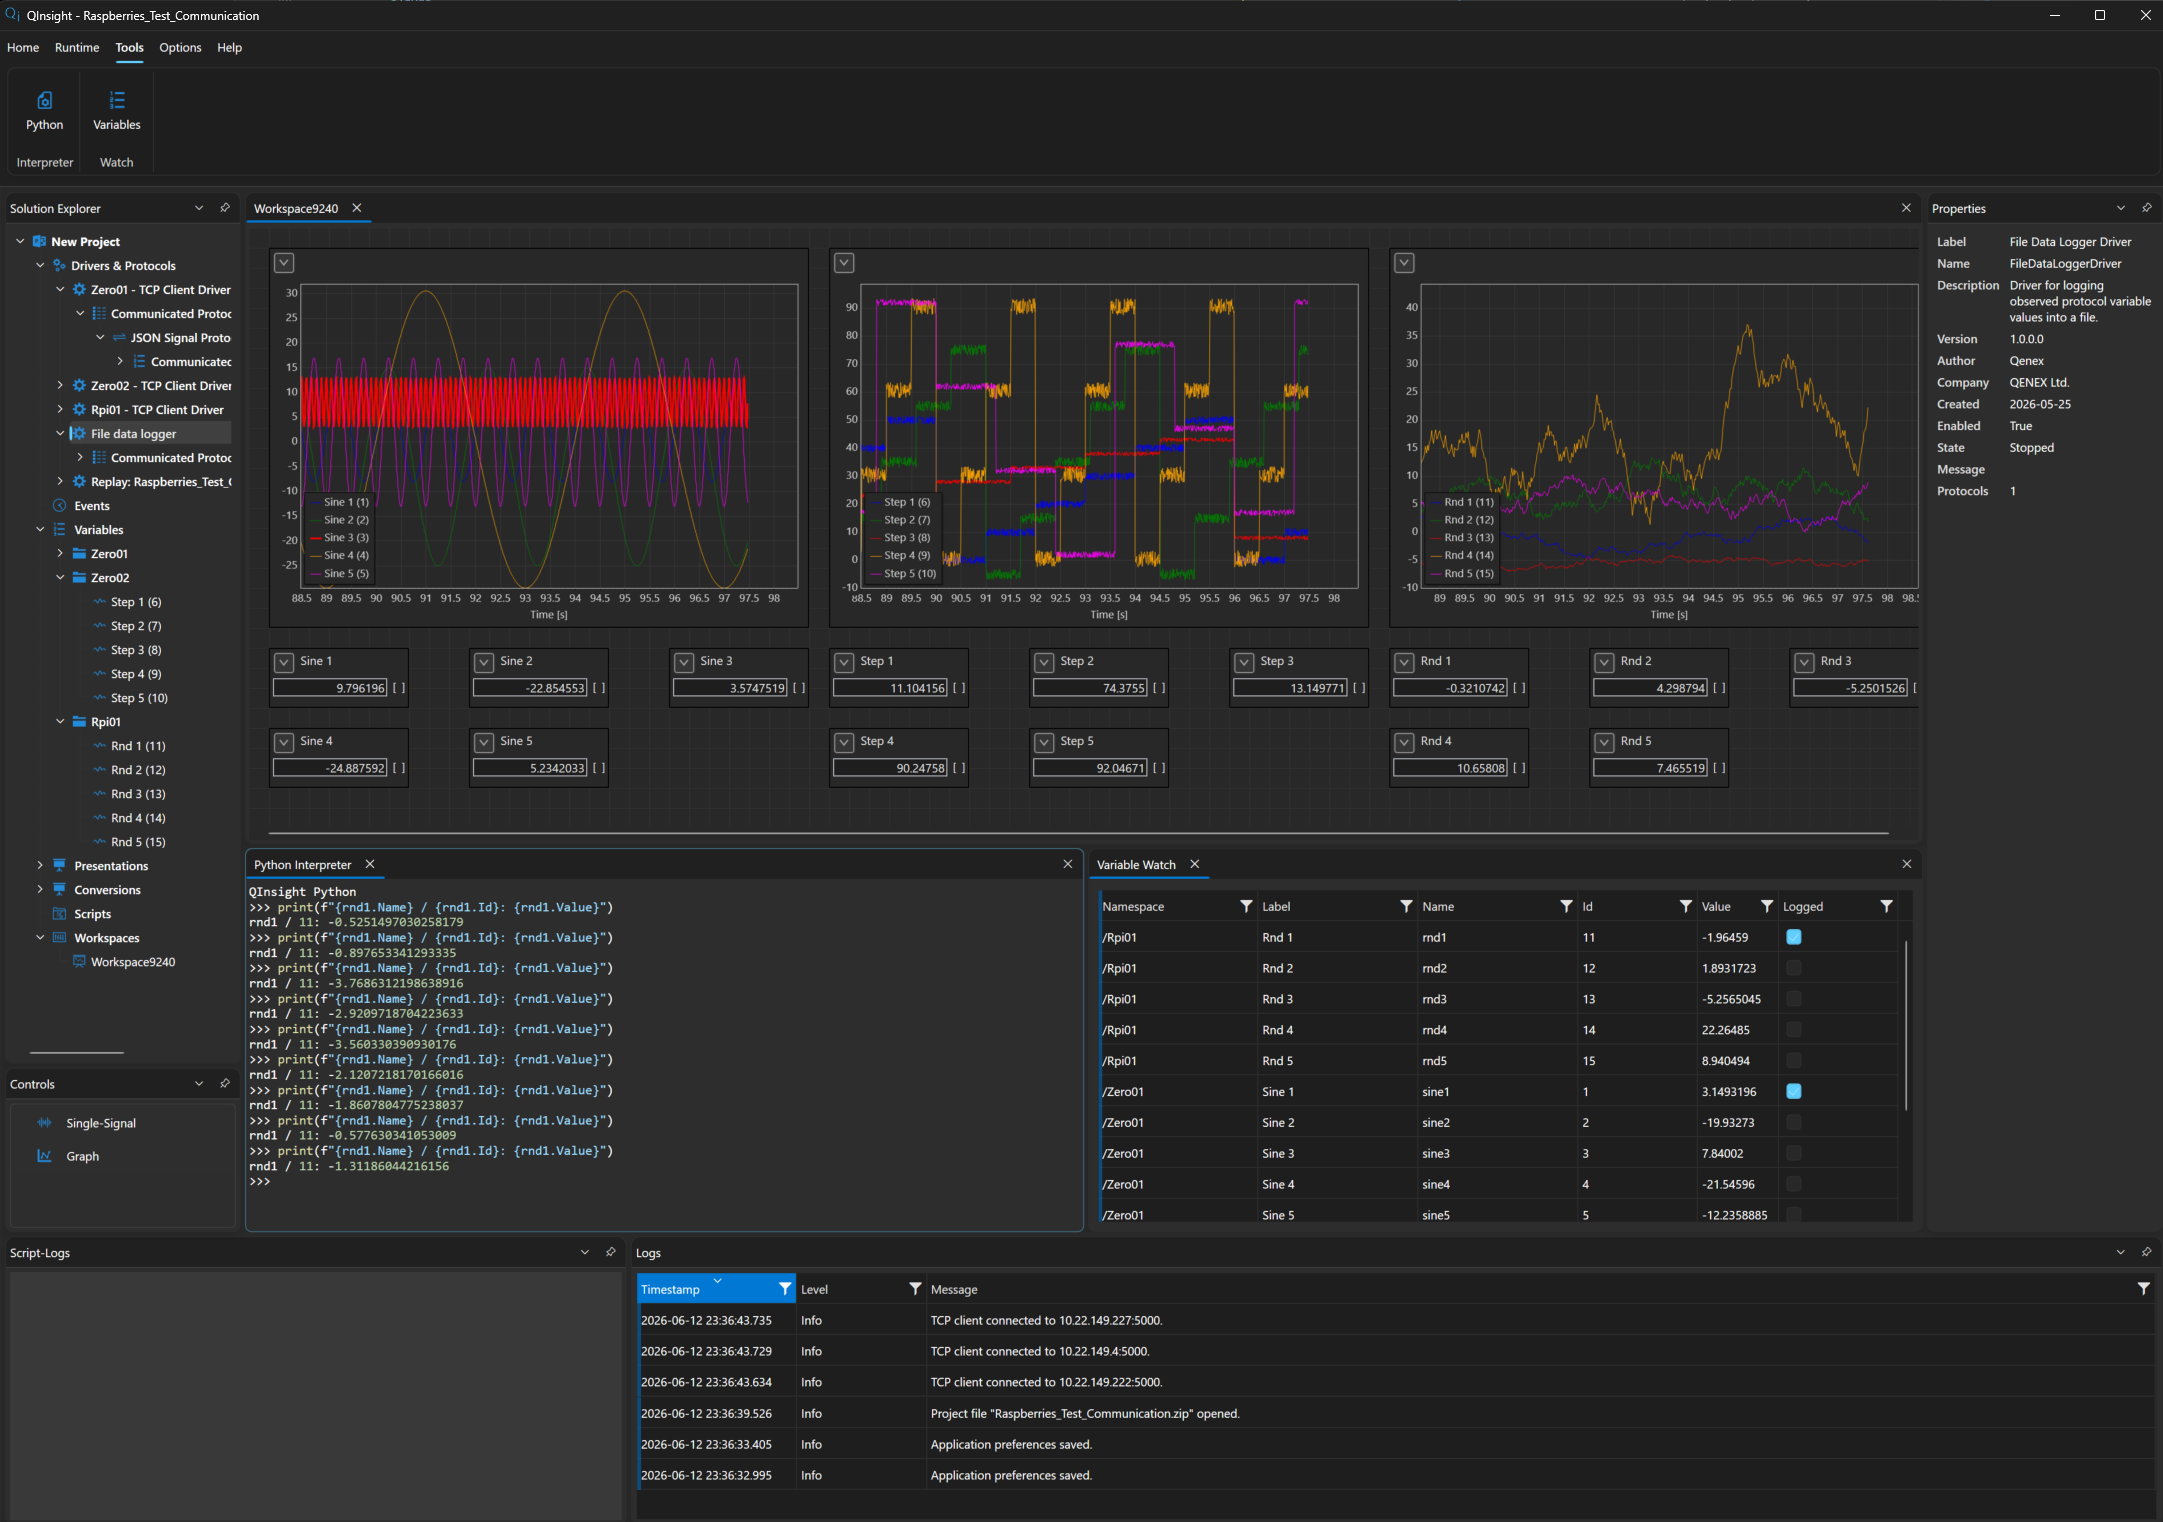
A visual workspace for live data, charts, logging, replay, and scriptable automation.
Connections to specific hardware and communication interfaces can be extended with custom drivers, protocols, Controls, and Python scripts.
Building blocks
QENEX Suite separates recurring technical layers from the specific application, so the next project does not start from scratch.
Real-time values communicated with external devices.
Libraries that connect QENEX Suite to your hardware.
Device communication over well-defined protocols.
User interface elements for workspaces and specialized operation can be added for each project.
Automate application behavior and analyze logged data later with scripts.
QInsight
Connect ECUs, embedded devices, and industrial controllers, watch their signals live, log them, and play them back — all from a desktop GUI. Light and dark themes included.
What QInsight can do
Serial line, TCP client and server, PEAK CAN — plus simulated data and log replay as data sources.
Modbus RTU/TCP as master or slave, XCP, raw CAN frames, and JSON messages.
Graph, Signal, Gauge, Matrix, and Watch table — including writing values back to the device.
Event-driven scripts filter and compute new signals directly in the running project.
Record measurements, replay them as a data source, and export to CSV.
Add your own drivers, protocols, and Controls as plugins — working examples included.
Display and control
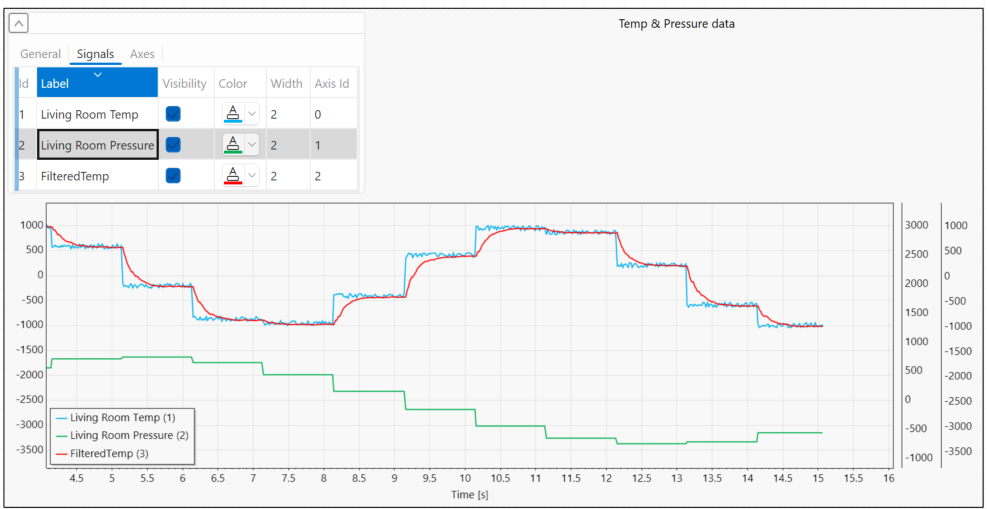
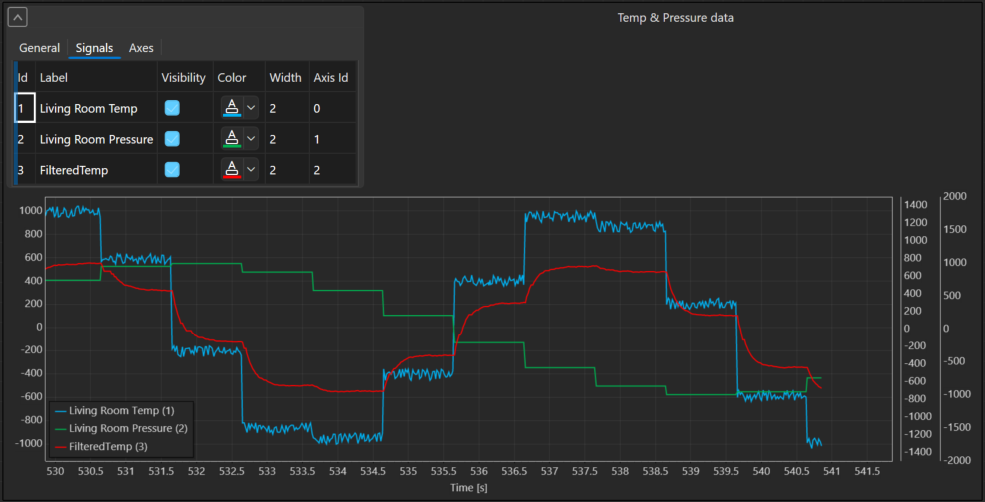
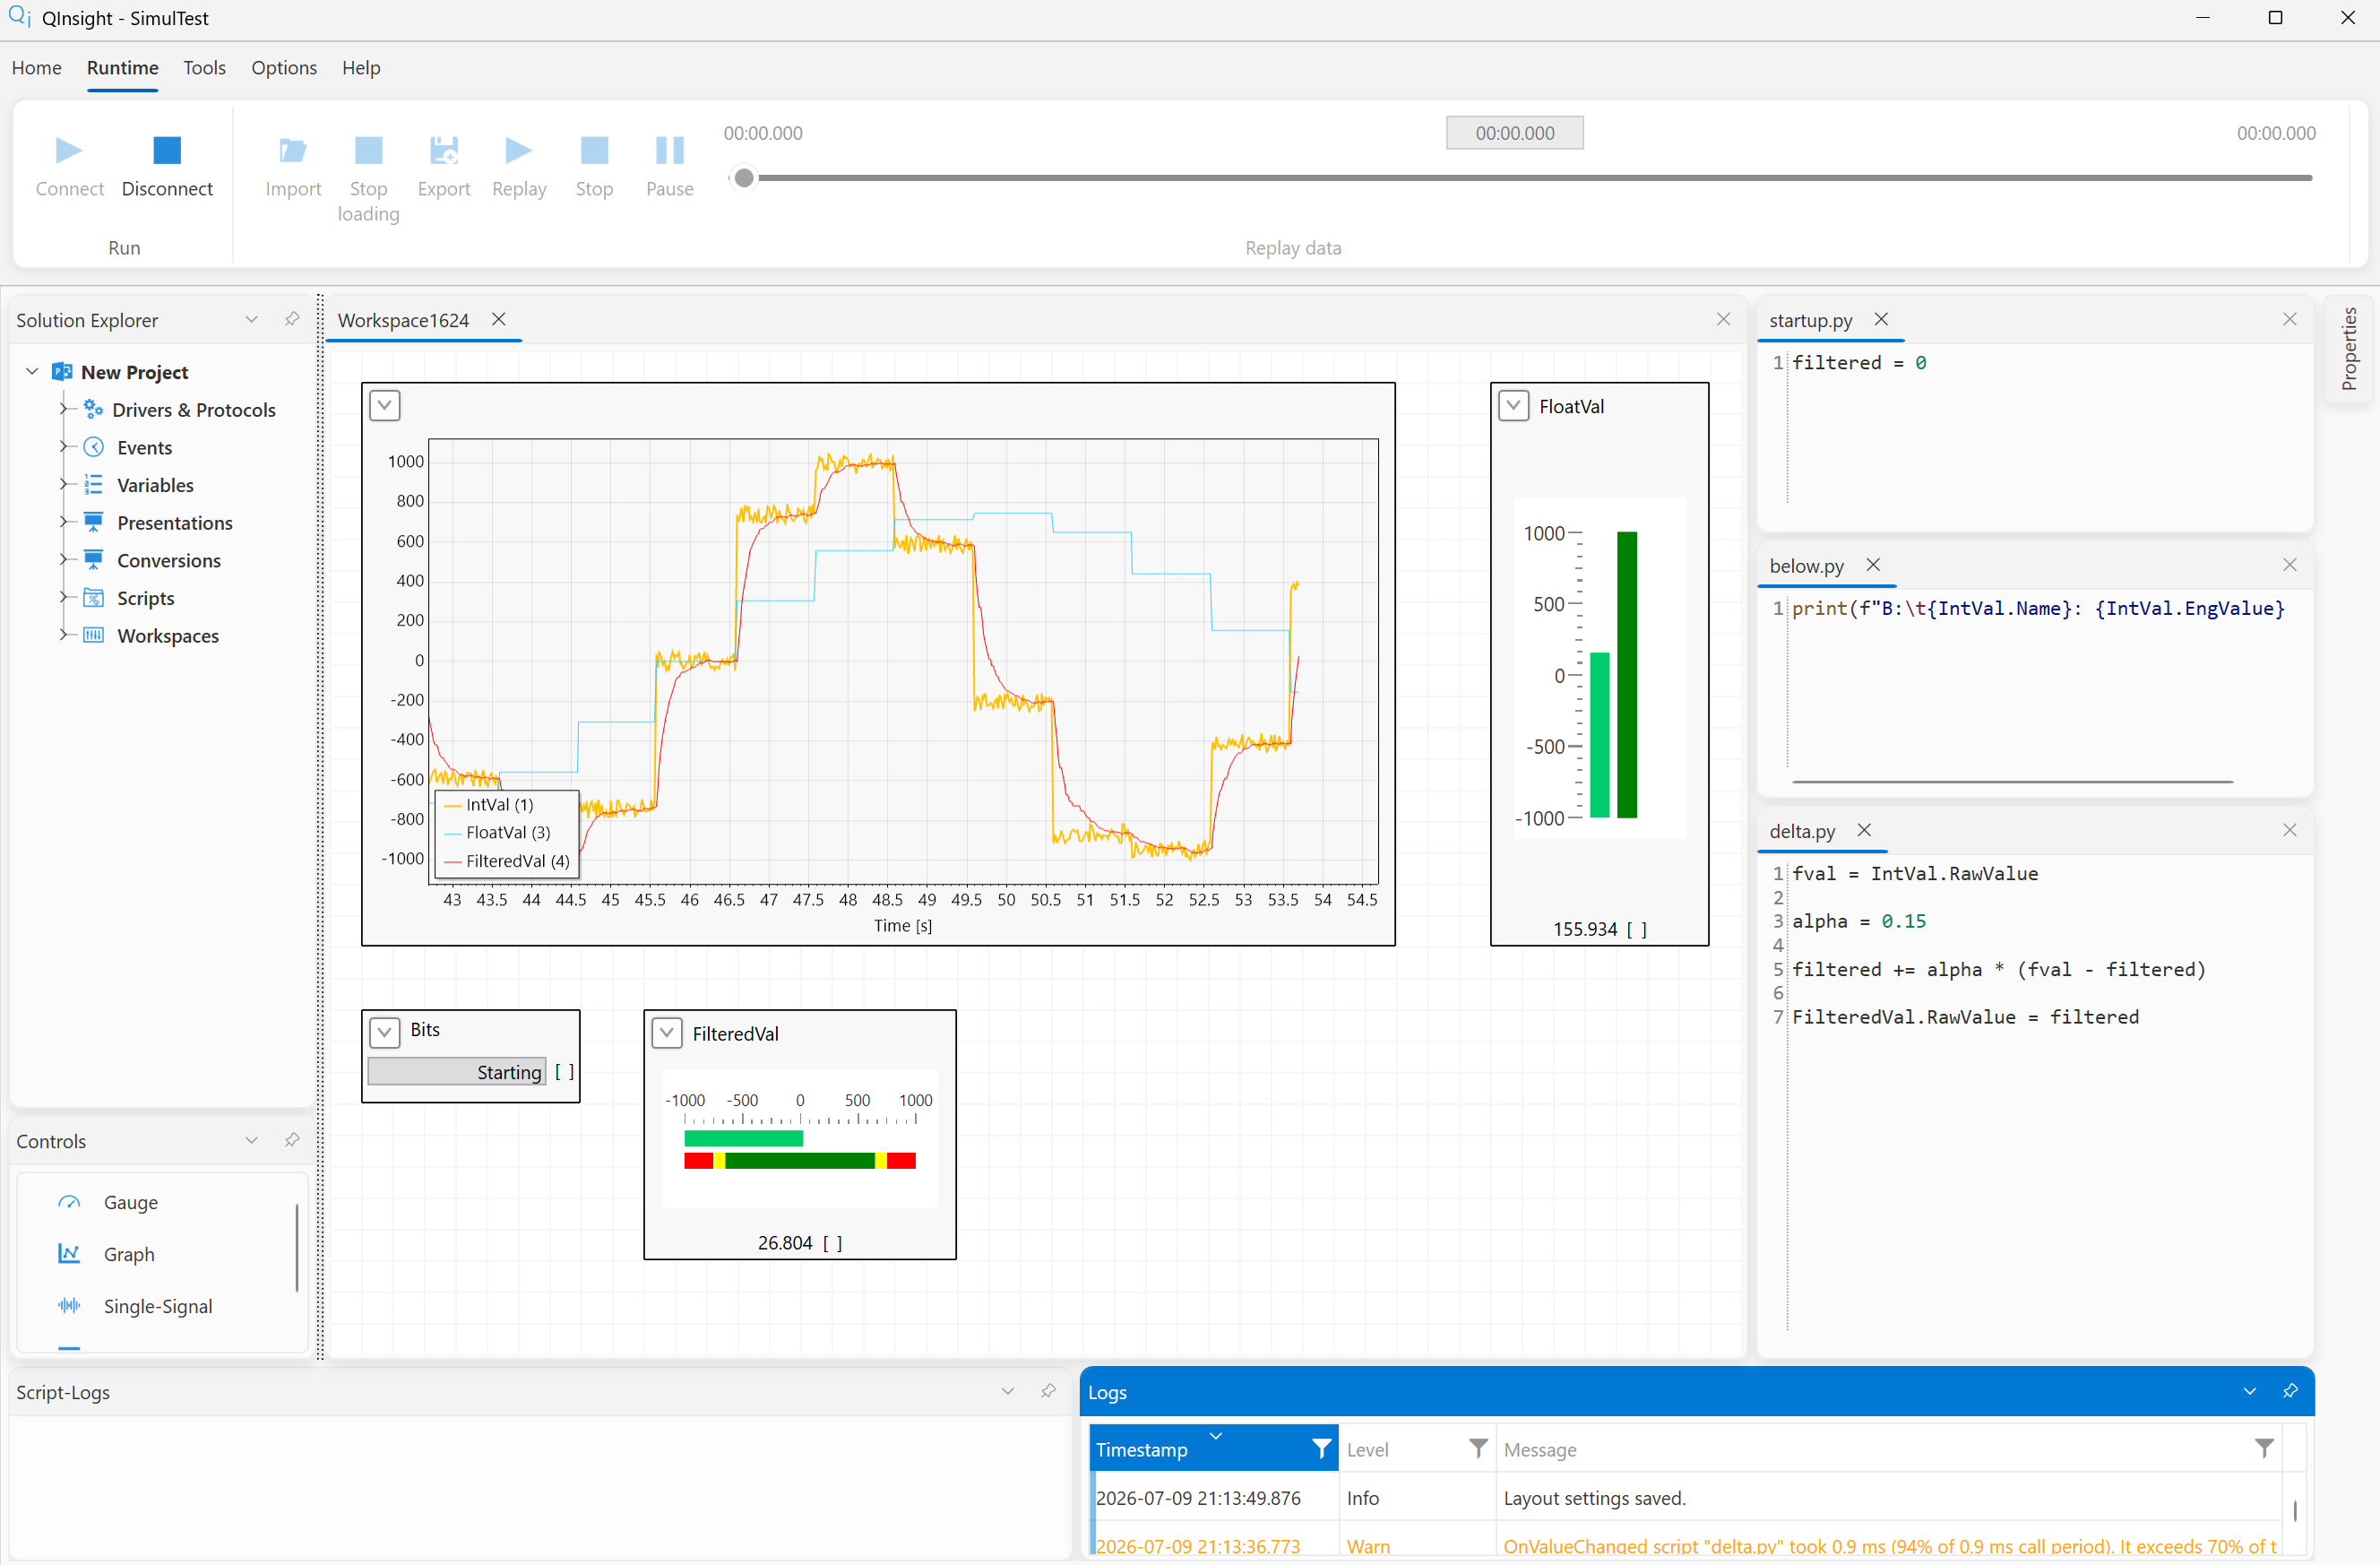
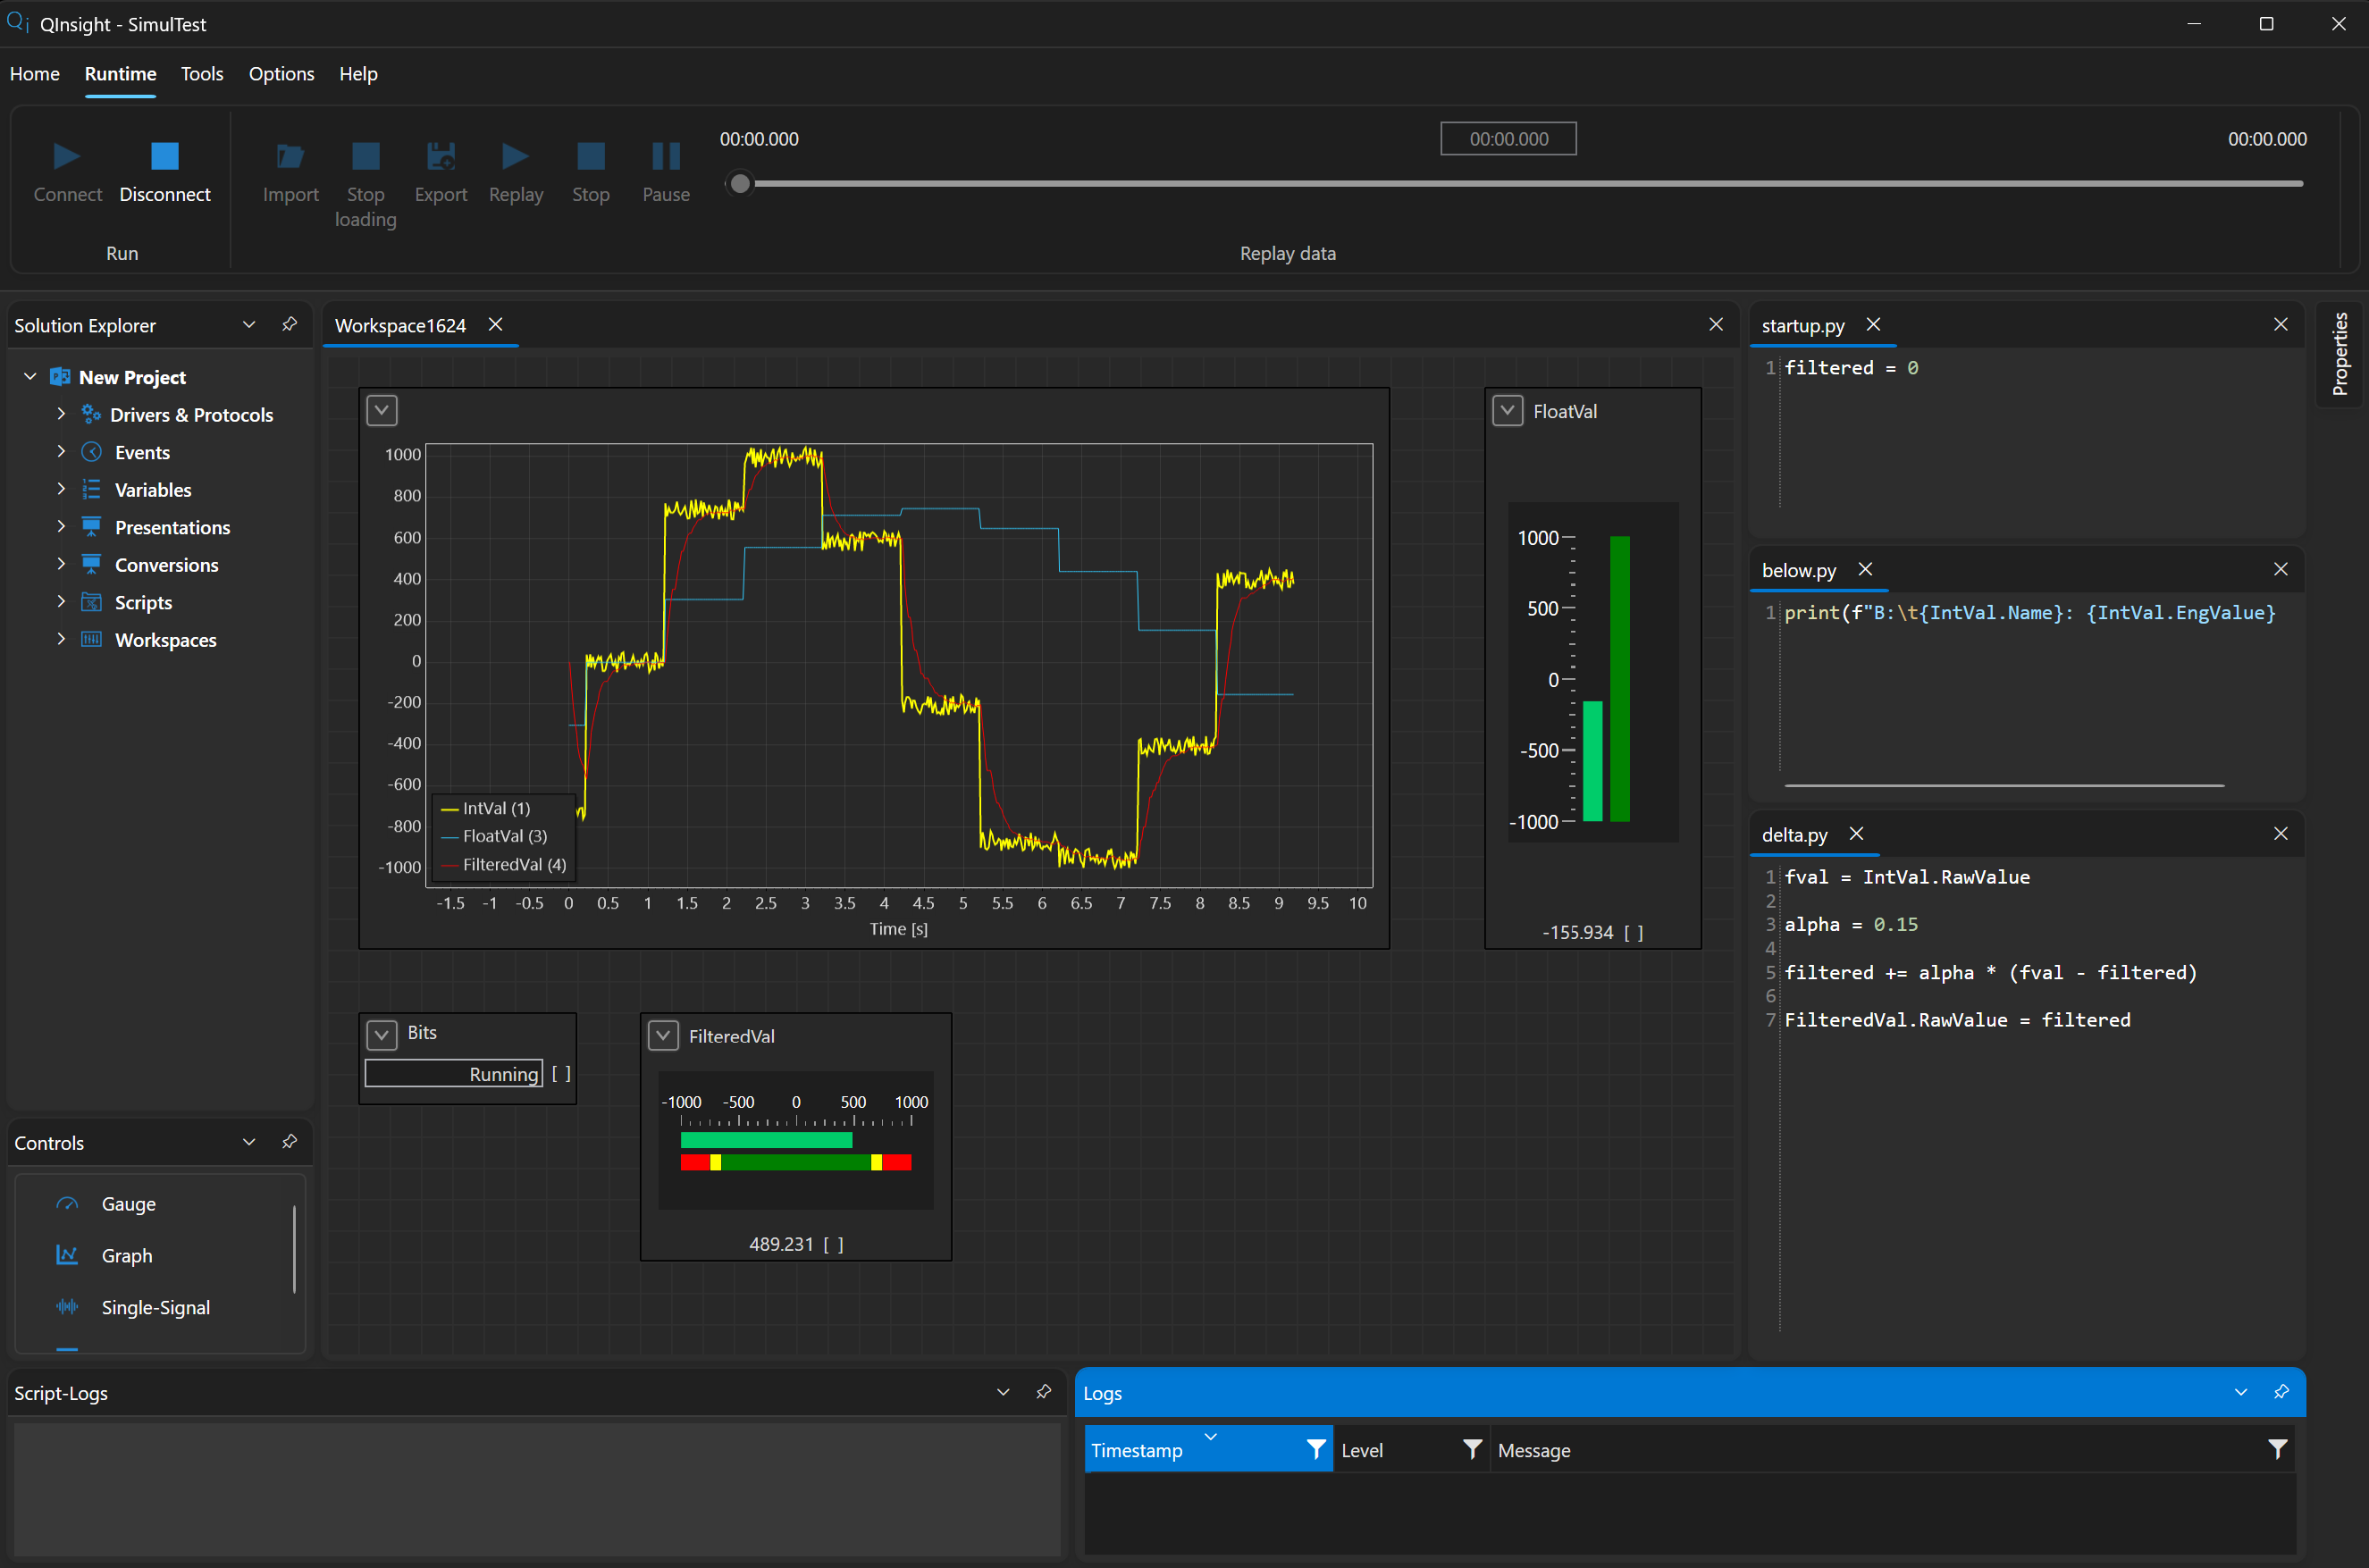
Workspaces are built from Controls — display and control elements such as charts, value displays, gauges, and watch tables. The Graph Control, for example, combines live signals, multiple data series, and a readable time axis — during a test as well as when reviewing recorded data. The set can be extended with custom Controls per project.
Live operation
During a run, the workspace shows all signals at once — charts, current values, and tables — while everything is being logged in the background.
Scriptable automation
Scripts can react to application runtime, transform values, and work with measured data. The same mechanism can also be used to evaluate stored logs after a run.


Virtual variables
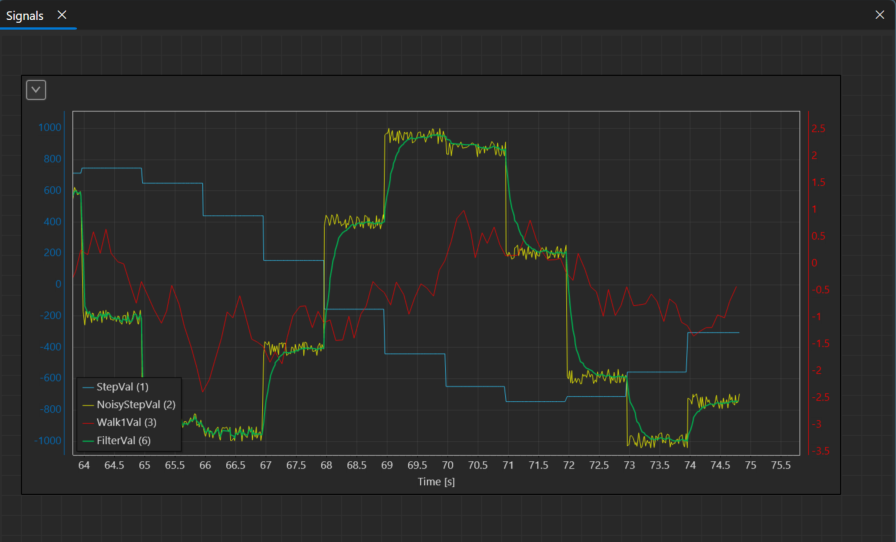
A short Python script turns a noisy signal into a filtered one — virtual variables behave like any other signal in charts and logs. The complete example is in the documentation.

See it in practice
The QInsight documentation contains complete examples — from project configuration to a live run. Three of them show what the platform can do.
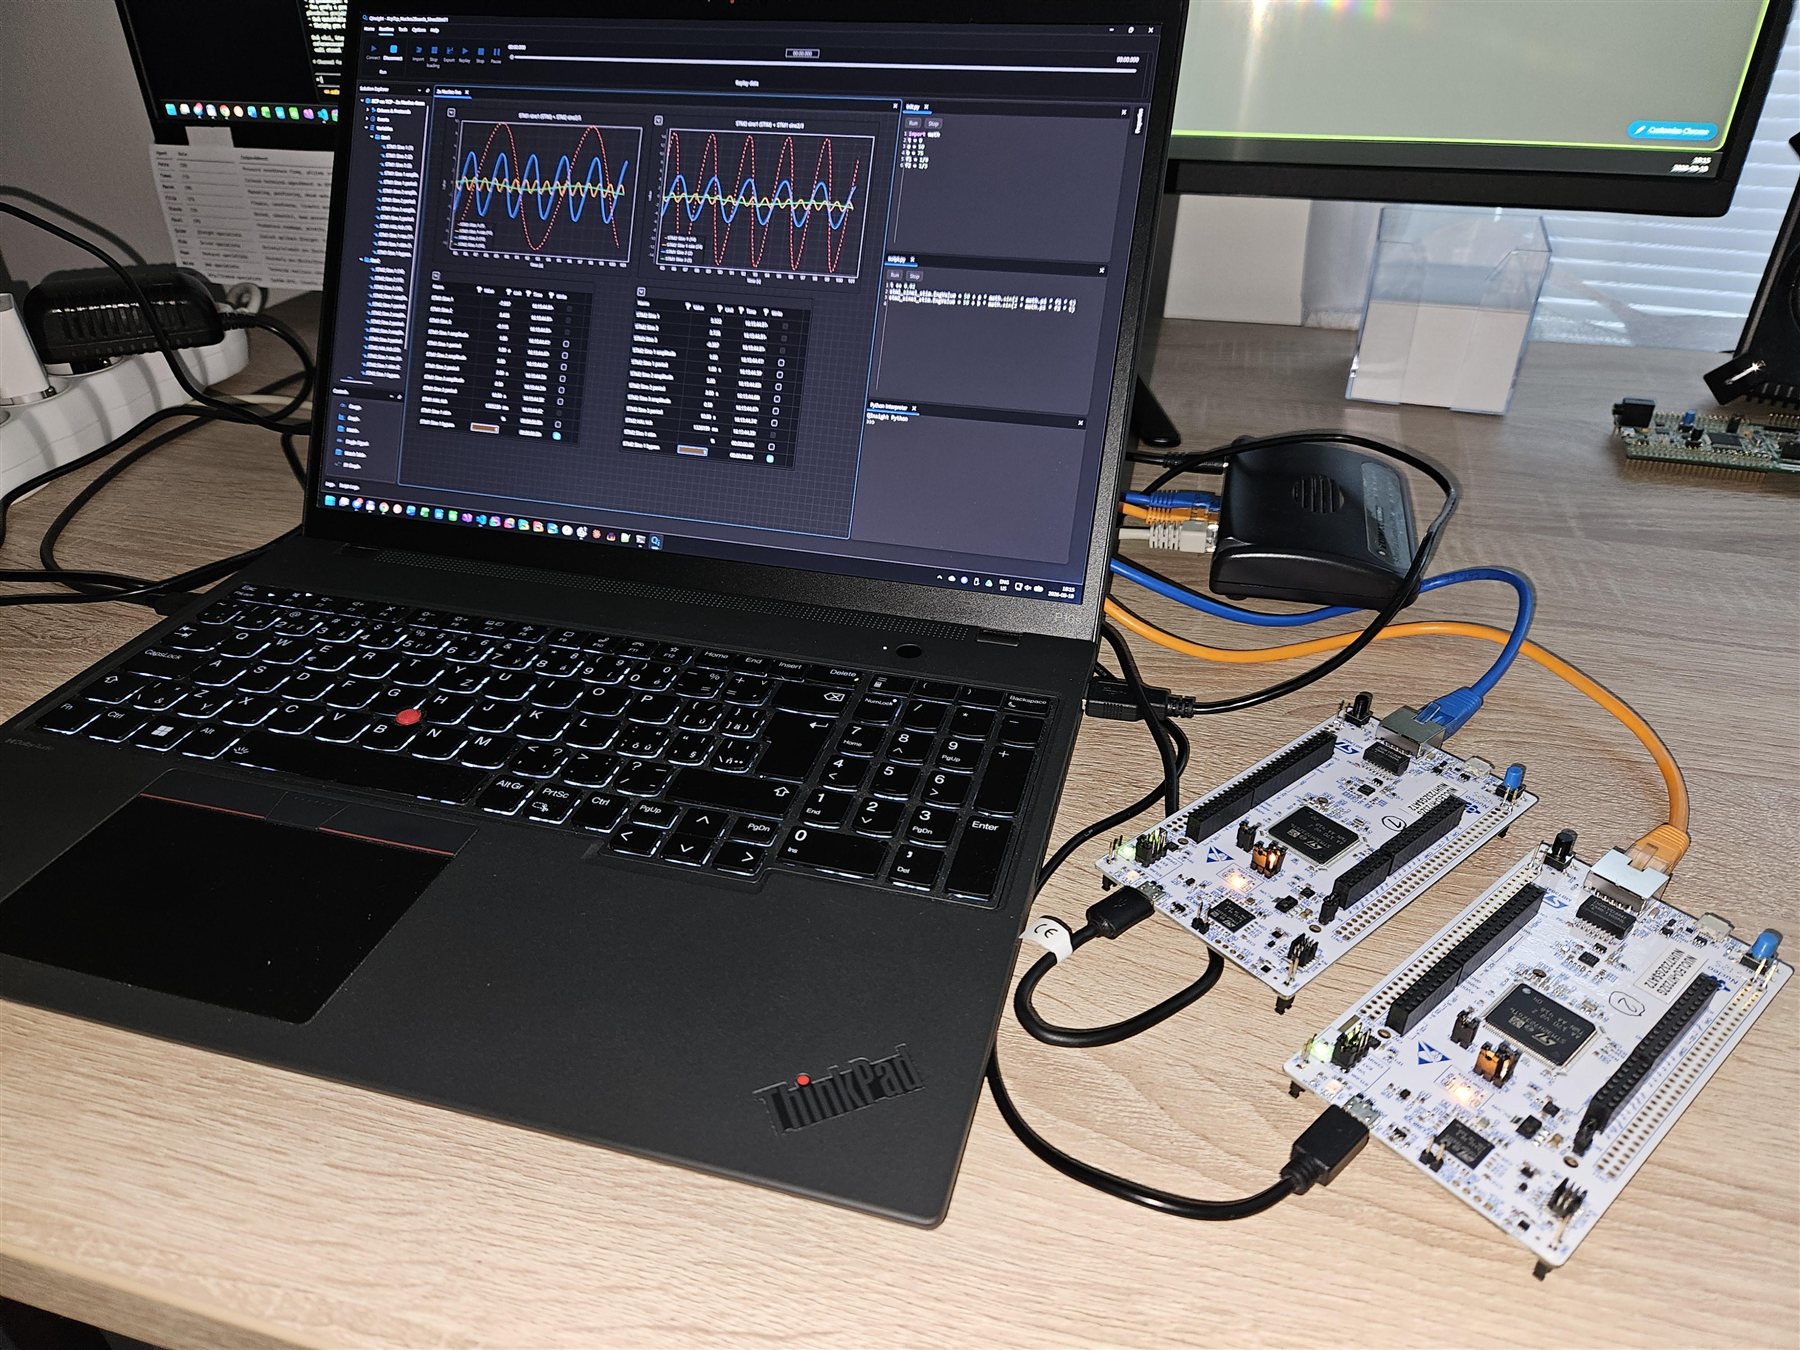
Two NUCLEO units on XCP on TCP — independent sessions, shared graphs, calibration and stimulation per unit.
Open the example →
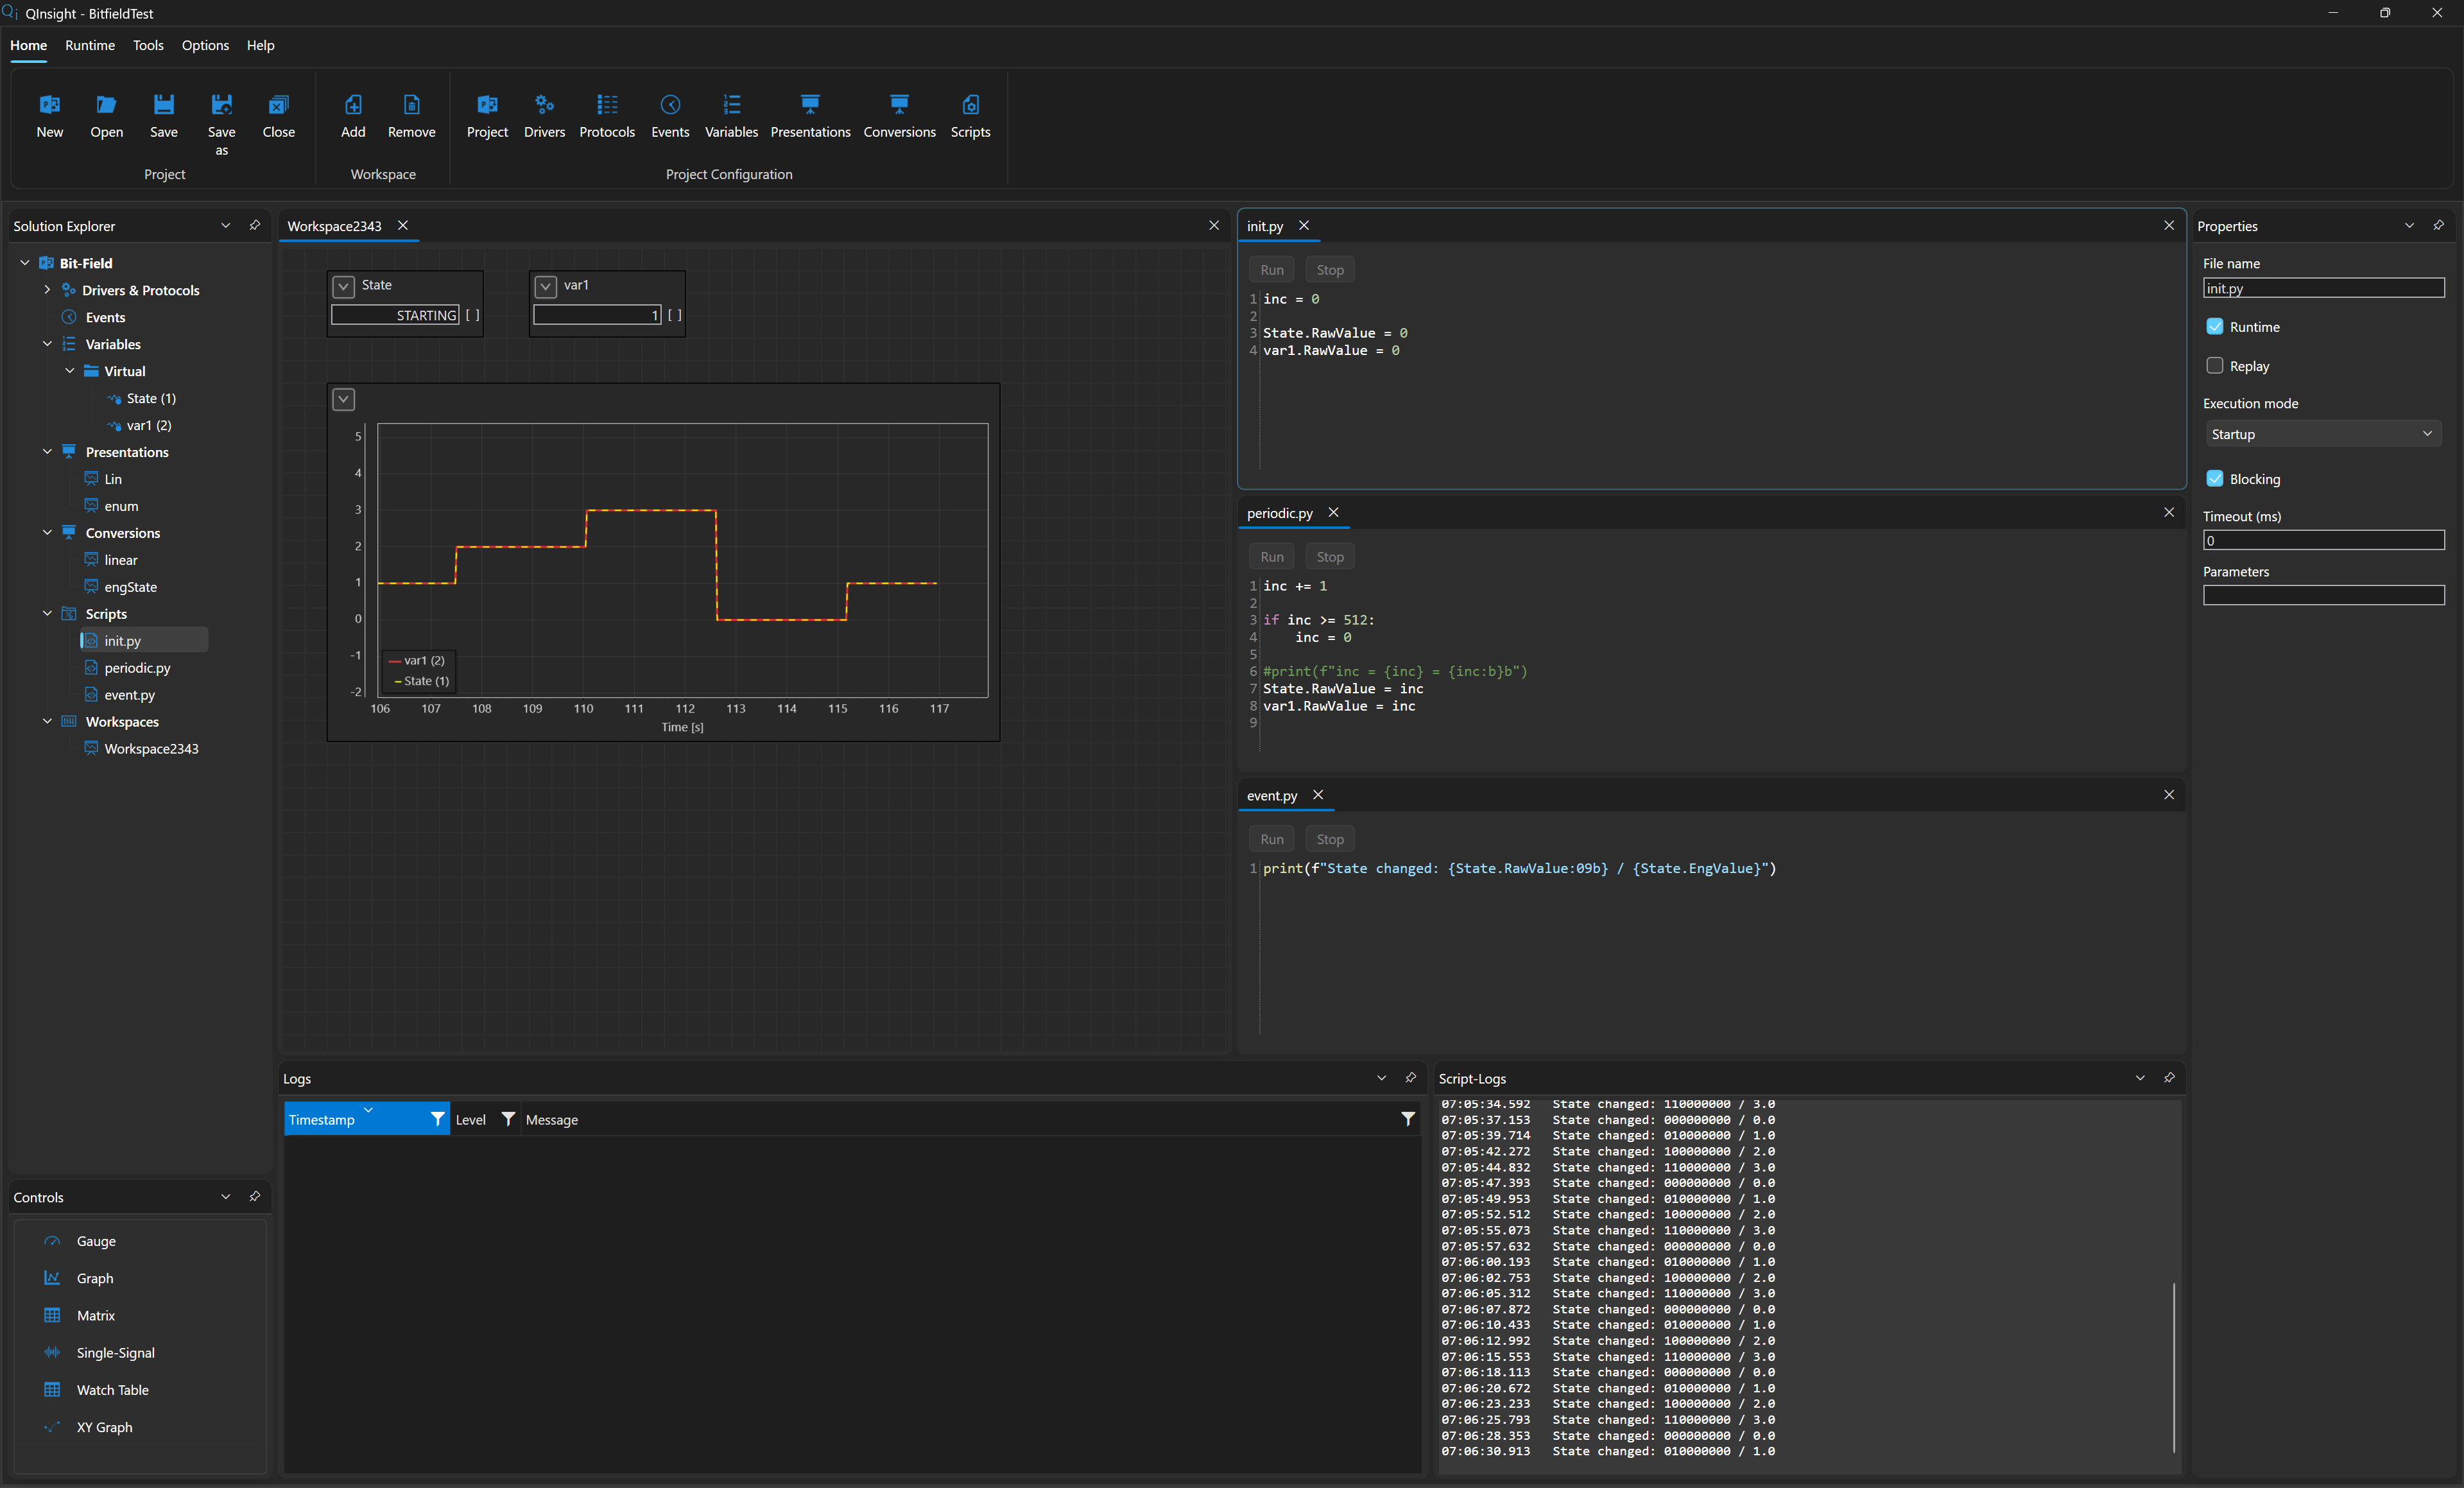
Two variables cut a state out of a status word, an enum names it, and an on-change trigger runs a Python script only on a real change.
Open the example →A short Python script turns a noisy signal into a filtered one — right inside the running project.
Open the example →More than software
QInsight is an open platform. The application comes with a device-side SDK and interfaces for custom extensions — both with documentation and working examples.
A library for your device firmware: an XCP slave that talks to QInsight directly — measurement, calibration, DAQ and stimulation.
Device SDK documentation →Drivers, protocols and Controls as plugins. Connect proprietary interfaces with your own extension, following documented examples.
How to write an extension →Typical workflow
QENEX Suite shortens the path between a physical device and a tool that an engineer can actually work with.
Select or add a driver, protocol, and custom Control for the specific hardware or communication interface.
Variables, conversions, logging, and scripts are composed in a unified project model.
QInsight shows the live state, stores data, and lets you return to it during debugging or testing.